Application of the Dynamical Network Biomarker Theory to Raman Spectra
Summary
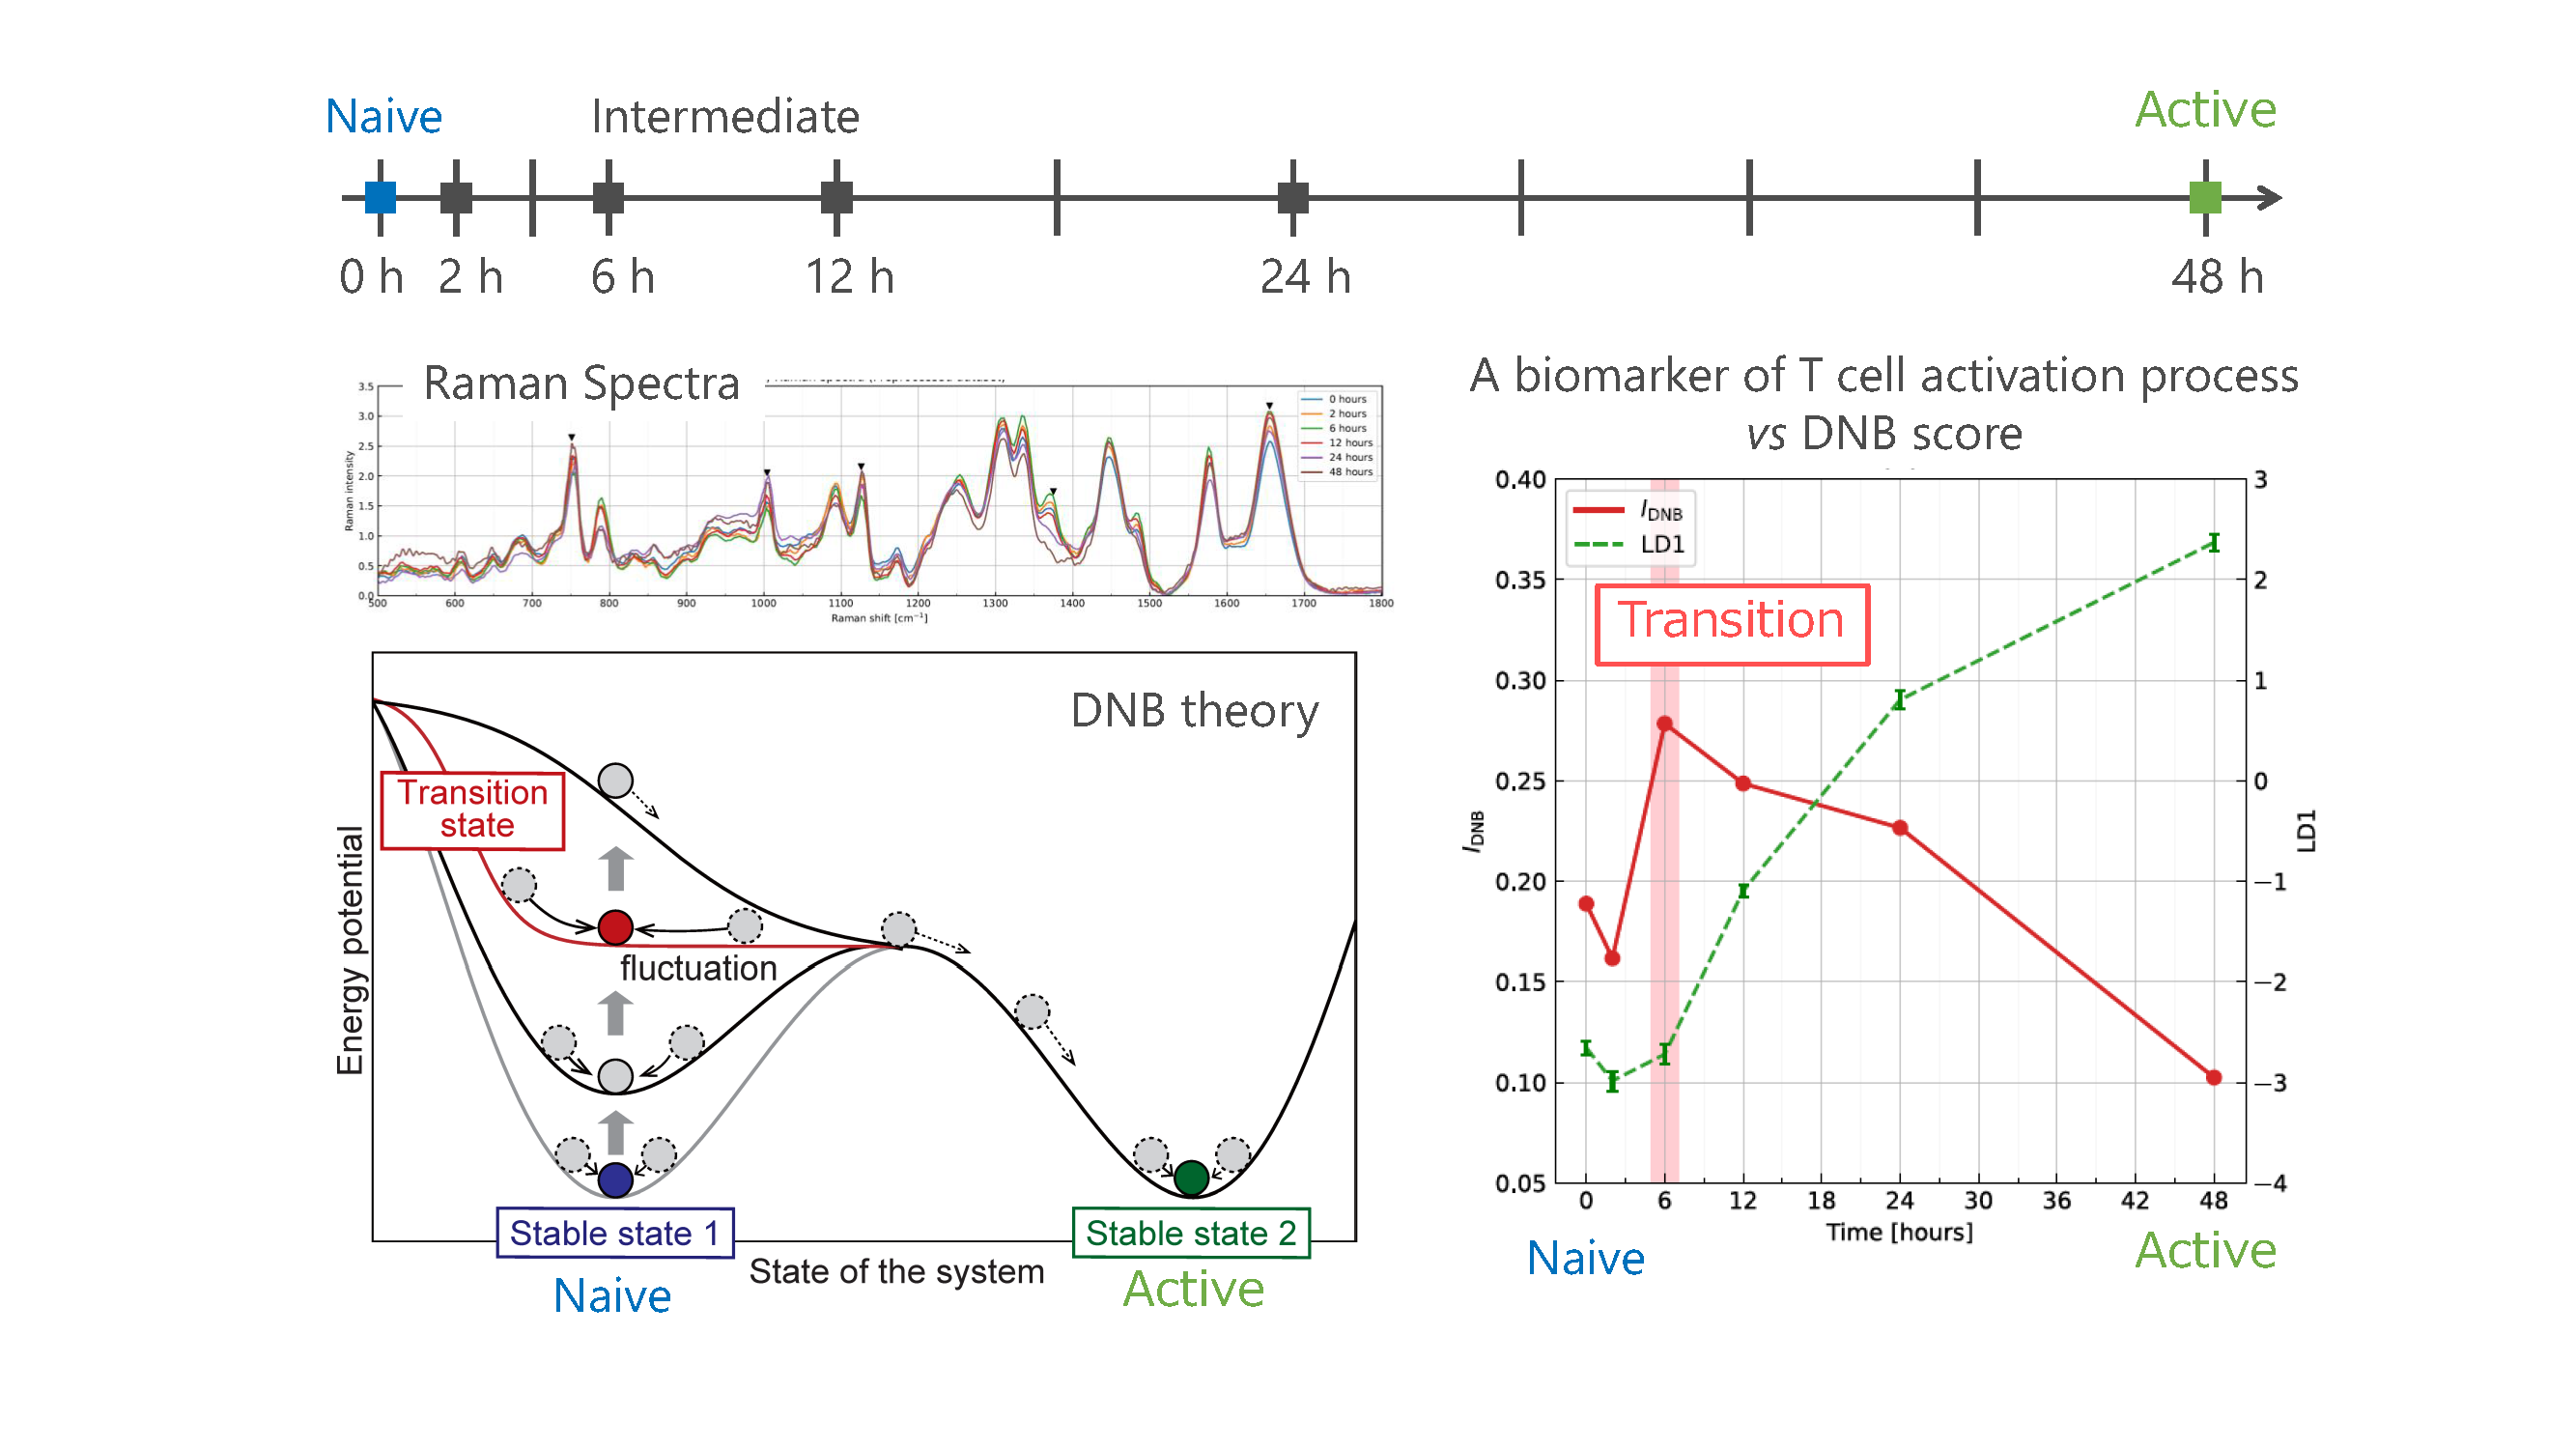
We applied the Dynamical Network Biomarker (DNB) theory to the Raman spectra of the T cell activation process and successfully detected the early warning signals of a transition state. The transition state of the T cell activation process is 6 hours (h) and the average discriminant score to distinguish between naïve and activation states of T cells in conjunction with the average cell area markedly increased between 12 and 24 h. This indicates that a hidden or non-phenotypic transition occurred immediately after 6 h and triggered later cell expansion.
The present results suggest novel applications of the DNB theory to Raman spectra, obtained with Raman spectroscopy, based on the label-free and noninvasive detection of early warning signals at the transition state in living cells or tissues. In fundamental research on cellular mechanisms, a number of applications will be possible for detecting the transition state in the process of not only cell activation, but also differentiation and apoptosis.
Graphical abstract
Background
The DNB theory detects the early warning signals of state transitions utilizing fluctuations in and correlations between variables in complex systems. The key concept of the DNB theory is that the stability of the target system gradually decreases before the transition and a subset of strongly correlated system variables begins to fluctuate due to increased susceptibility to disturbances. These abnormal fluctuations peak at the transition state, namely, the state just before a transition. Therefore, by focusing on fluctuations and correlations, particularly at the transition state, it is possible to detect the early warning signals of an upcoming transition.
Although the DNB theory has been applied to gene expression in several diseases, destructive testing by microarrays is a critical issue. Therefore, other biological information obtained by non-destructive testing is desirable; one such piece of information is Raman spectra measured by Raman spectroscopy. Raman spectroscopy is a powerful tool in life sciences and many other fields that enable the label-free non-invasive imaging of live cells and tissues along with detailed molecular fingerprints.
The principle of Raman spectroscopy involves the inelastic scattering of light by molecules. The majority of light is scattered at the same frequency as incident light (Rayleigh scattering). Raman scattering, which is markedly weaker than Rayleigh scattering, gains or loses energy equivalent to the allowed molecular vibrations. A Raman spectrum is obtained by measuring the number of scattered photons (light intensity) versus differences in the frequency or wavenumber between scattered light and incident light (Raman shifts). Raman spectral data offer the advantage of shape bands, which may be assigned to molecular species or functional moieties; therefore, numerous studies, including our own, have been published on Raman spectroscopy for biological applications.
Results
The average discriminant score to distinguish between naïve (0 h) and activation states (48 h) of T cells gradually increased over time, reaching a maximum at 48 h. Naïve T cells became fully activated until 48 h. This is consistent with the cell area as a biomarker. However, it was difficult to identify transition states through the changes. Therefore, a different method was required to detect the transition state during the T cell activation process.
In the DNB analysis (application of DNB theory to Raman spectra here), a wide variety of DNB candidate groups were obtained at 6 h. We extracted 163 Raman shifts showing significantly large fluctuations from 1300 types of Raman shifts at 6 h using the F-test and Benjamini–Hochberg method. The hierarchical clustering method was then applied, producing the dendrogram. The largest cluster was extracted as a DNB candidate group. The DNB score peaked at 6 h and then decreased, reaching a minimum at 48 h. The average standard deviation had large values at 6 and 12 h and the average correlation strength peaked at 6 h. Therefore, we concluded that 6 h was the transition state for the T cell activation process and the 81 related Raman shifts were identified as DNB elements.
Future direction
Based on the identification of the transition state on blood cells (T cells), we will detect the transition state (pre-disease state) between healthy and disease states using Raman spectroscopy and related DNB Raman shifts in future clinical studies.
Original article information
Journal
Biomolecules 12, 1730 (2022)
Title
Application of the Dynamical Network Biomarker Theory to Raman Spectra
Authors
Takayuki Haruki, Shota Yonezawa, Keiichi Koizumi, Yasuhiko Yoshida, Tomonobu M. Watanabe, Hideaki Fujita, Yusuke Oshima, Makito Oku, Akinori Taketani, Moe Yamazaki, Taro Ichimura, Makoto Kadowaki, Isao Kitajima, and Shigeru Saito